Plotly and Dash Cookbook
🖼️ Data Visualisation with Plotly Cookbook. It will contain over 119 recipes for Interactive Visualizations and Dashboards with Plotly and Dash.
A selection of open-source projects I’ve developed over the years, independently of my professional work—driven by curiosity, community, and the joy of building.
🖼️ Data Visualisation with Plotly Cookbook. It will contain over 119 recipes for Interactive Visualizations and Dashboards with Plotly and Dash.
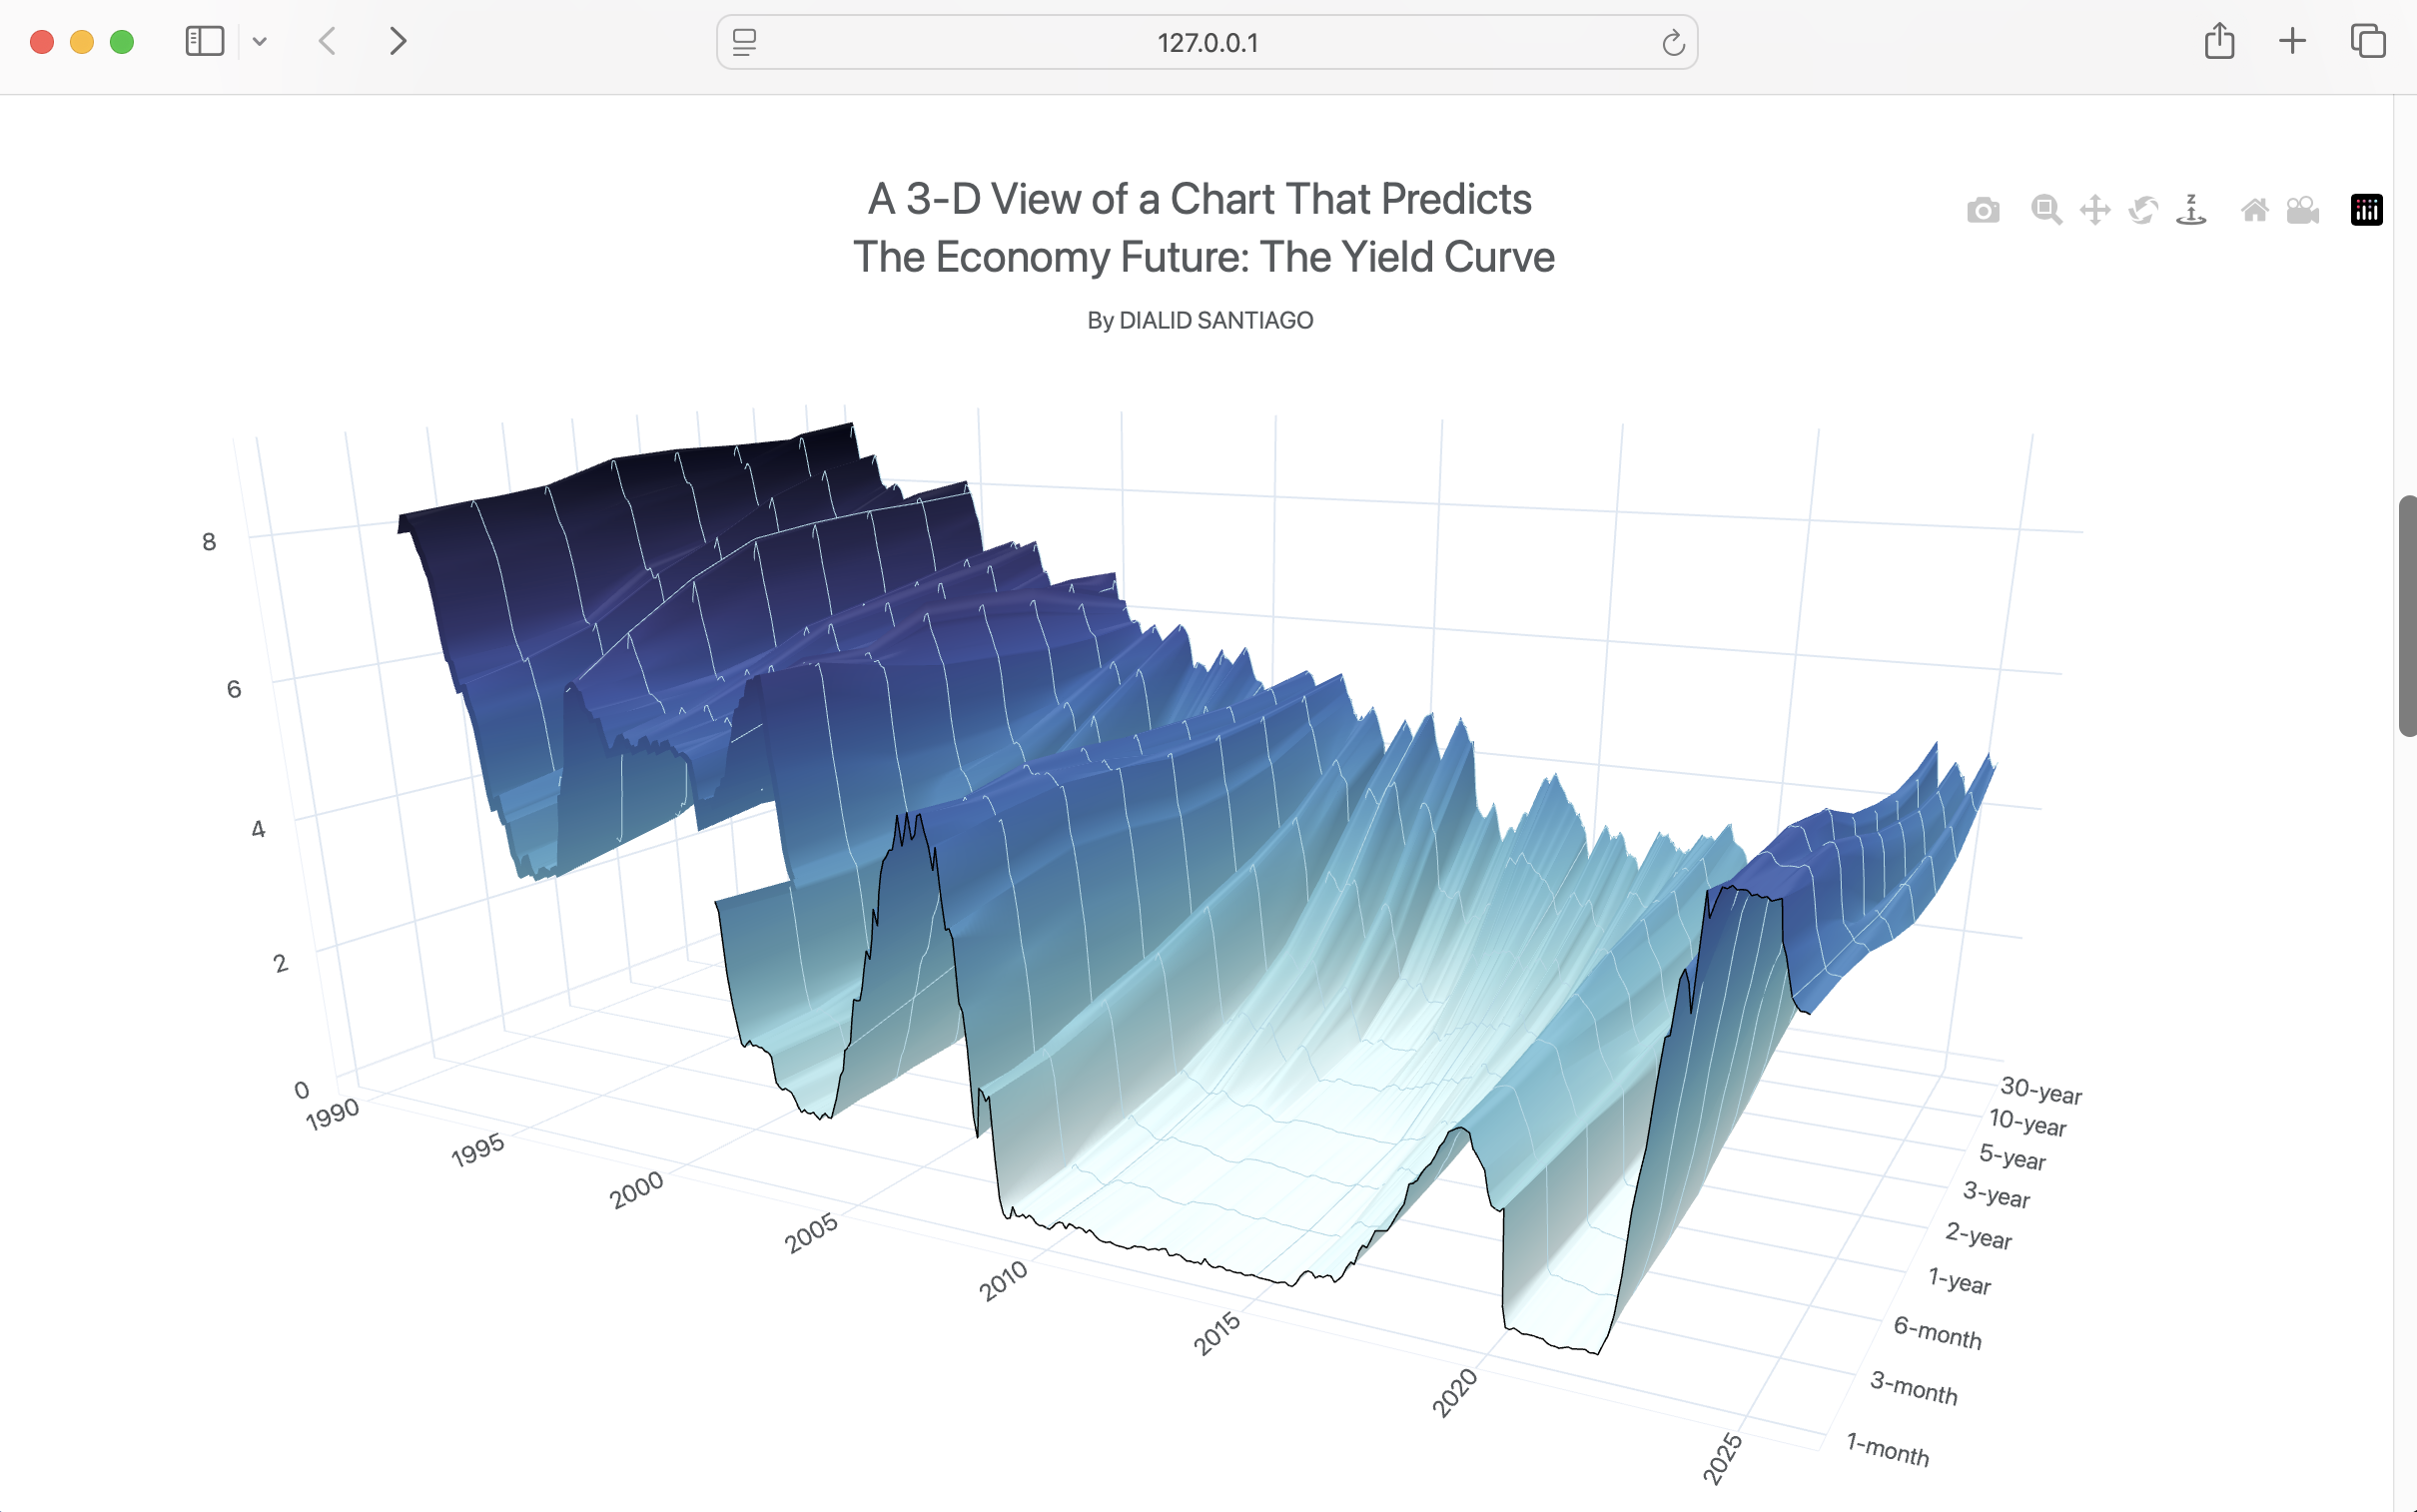
📈 A Dash app showing Interactive Visualisation of the Yield Curve UK and US.
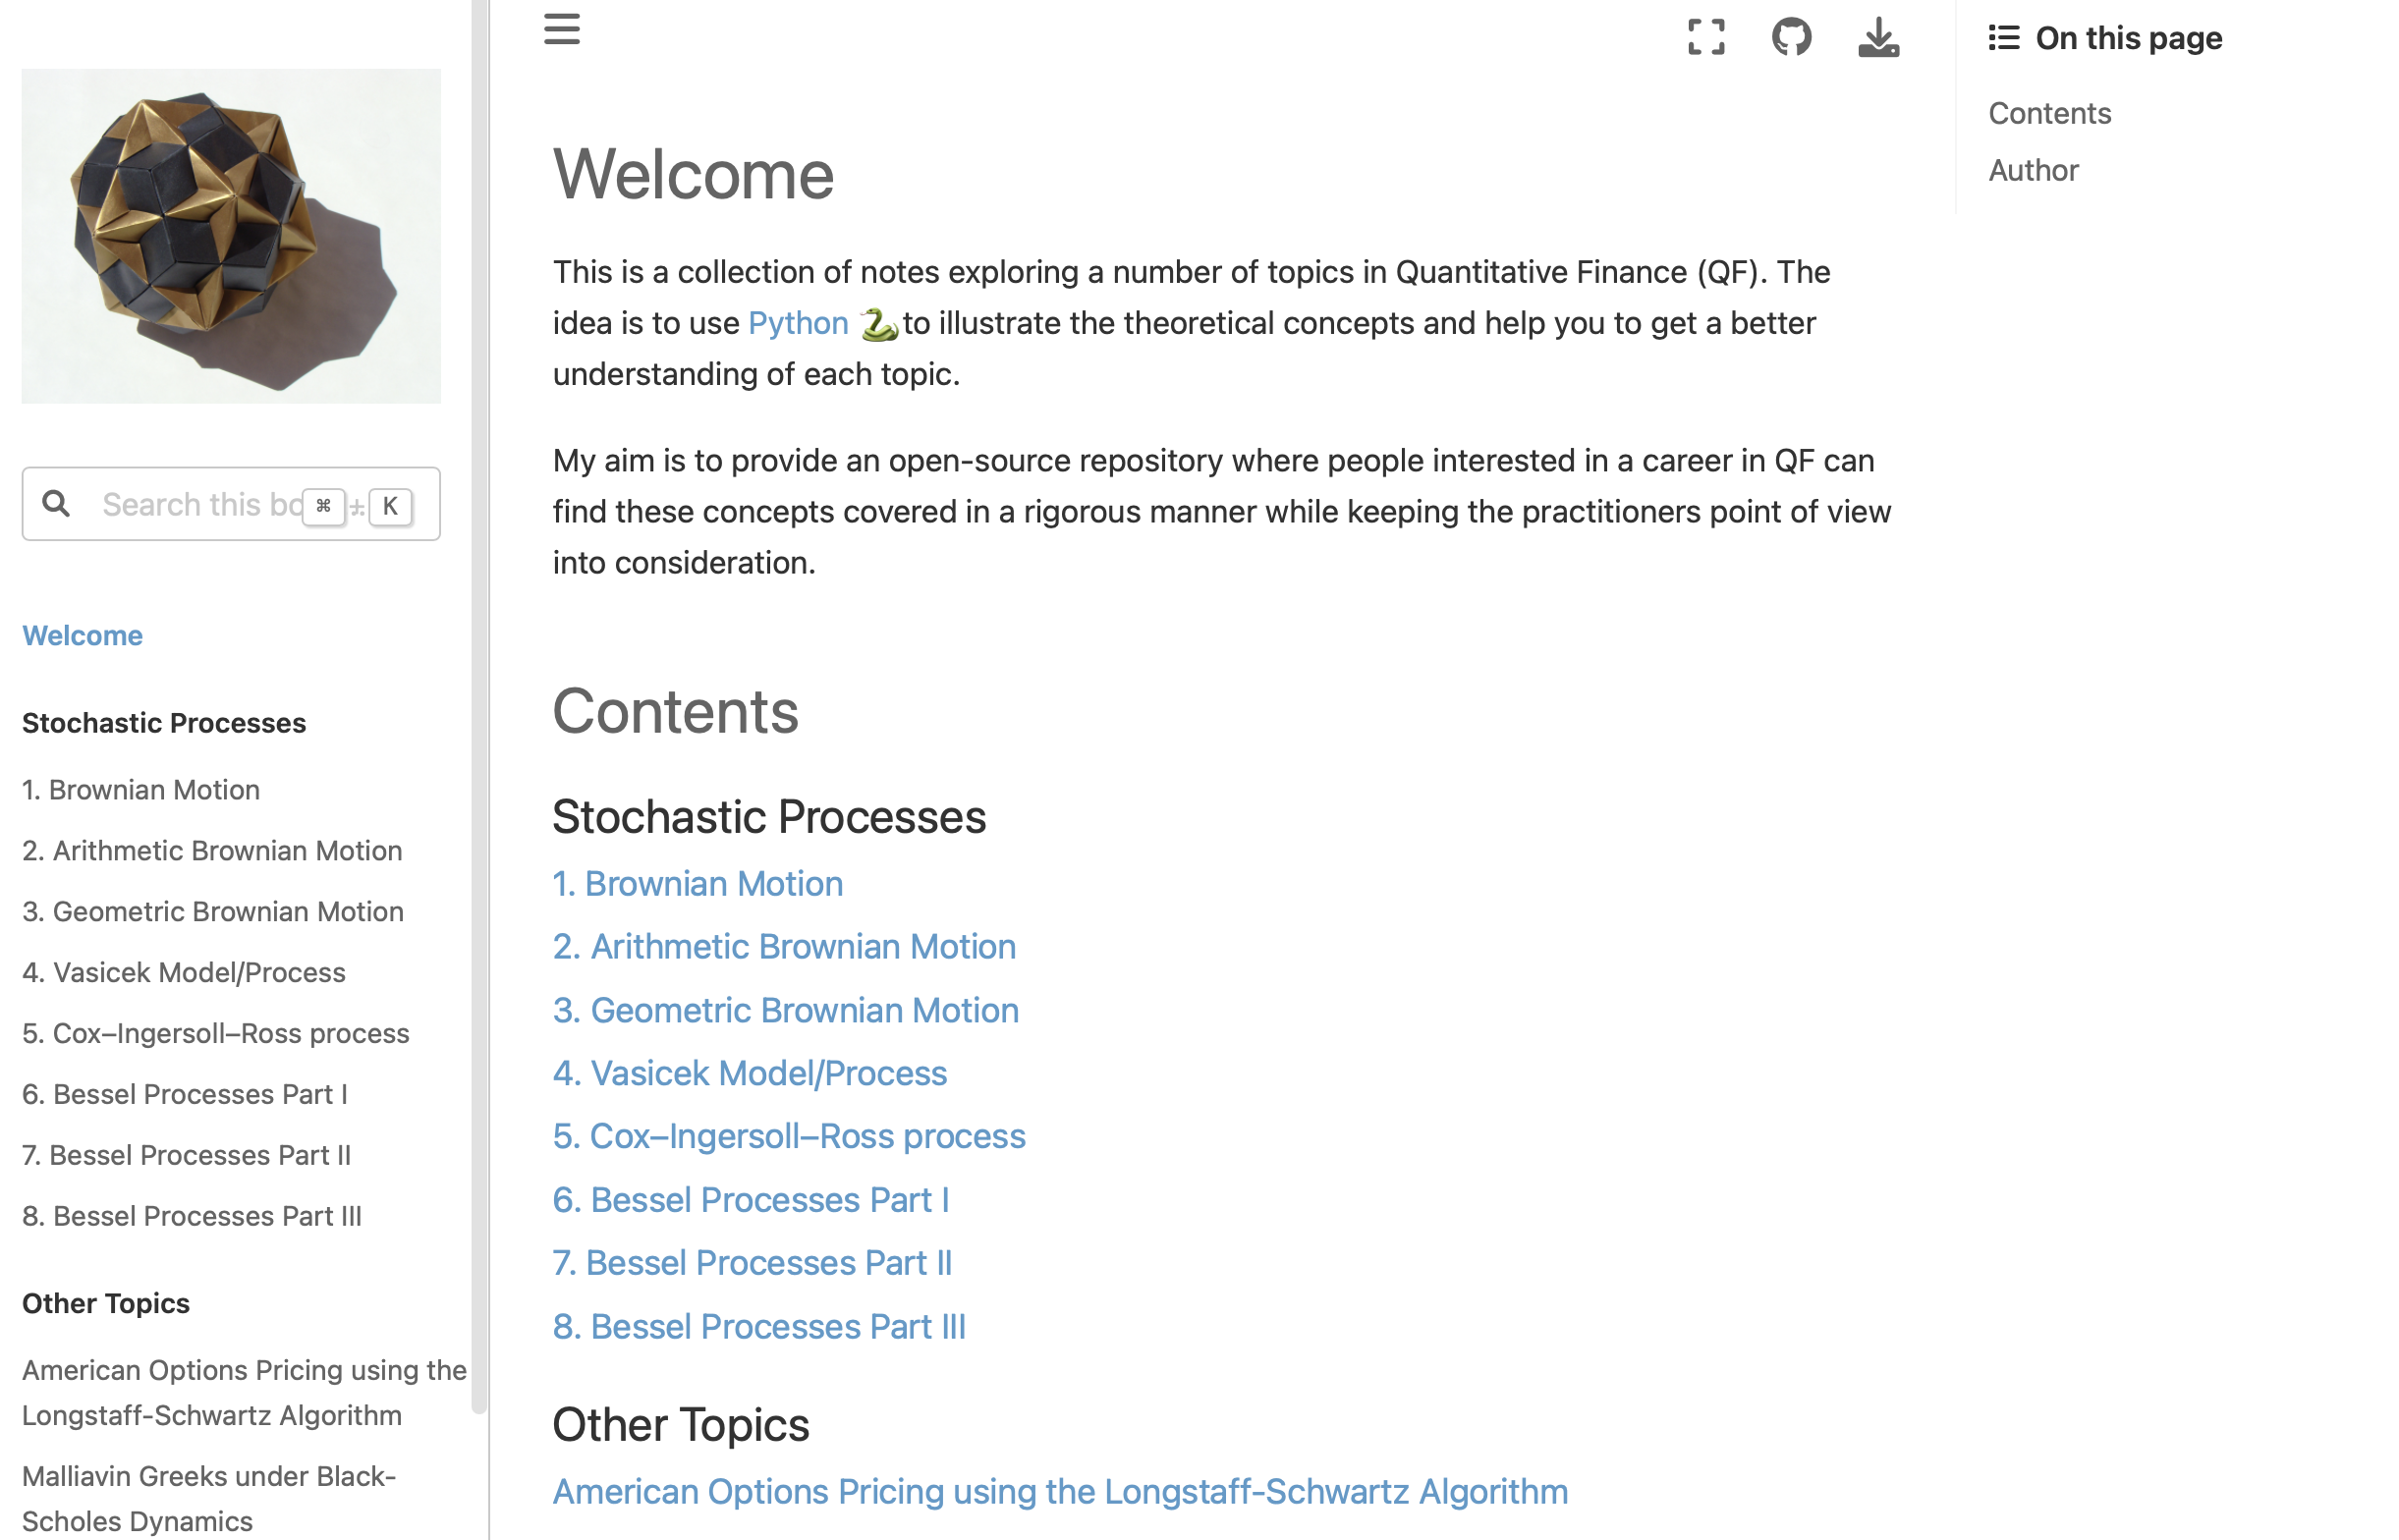
📒 A collection of notes exploring a variety of topics in Quantitative Finance (QF). The idea is to use Python 🐍to illustrate the theoretical concepts and help you to get a better understanding of each concept.
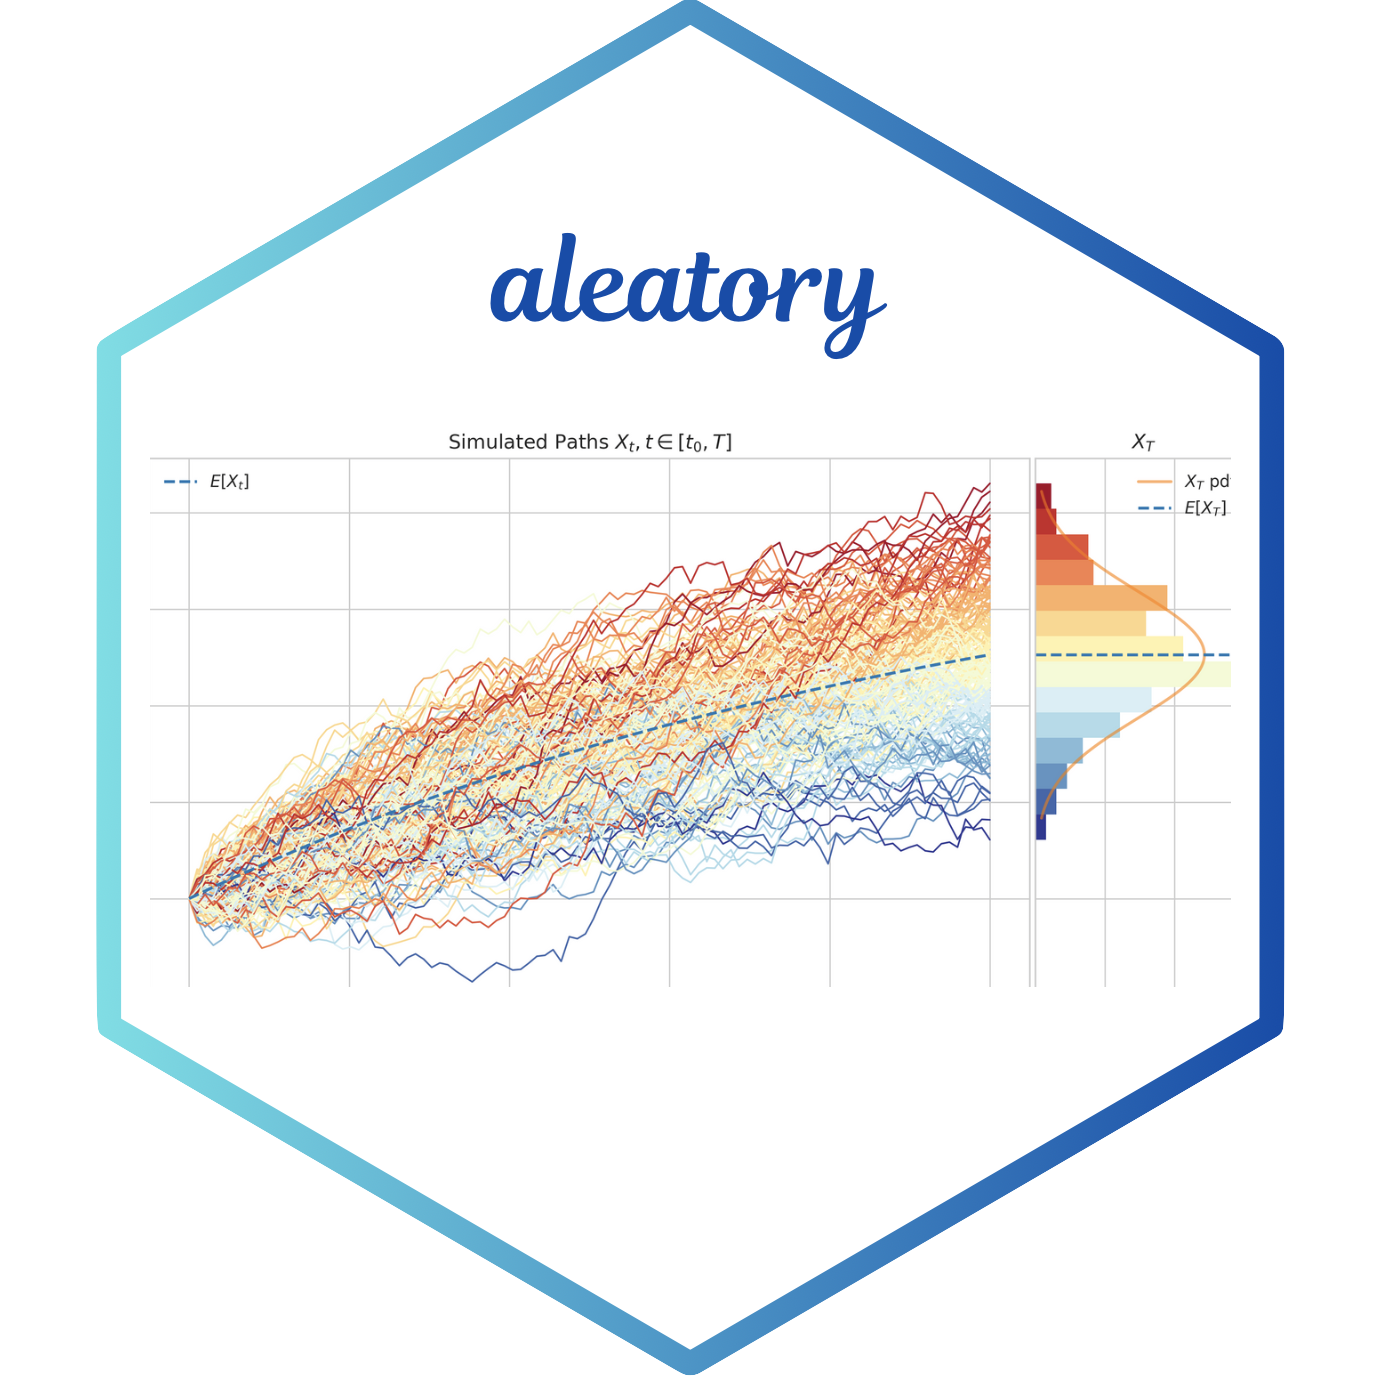
📦 Python library for Stochastic Processes Simulation and Visualisation. Covers more than 24 stochastic processes.
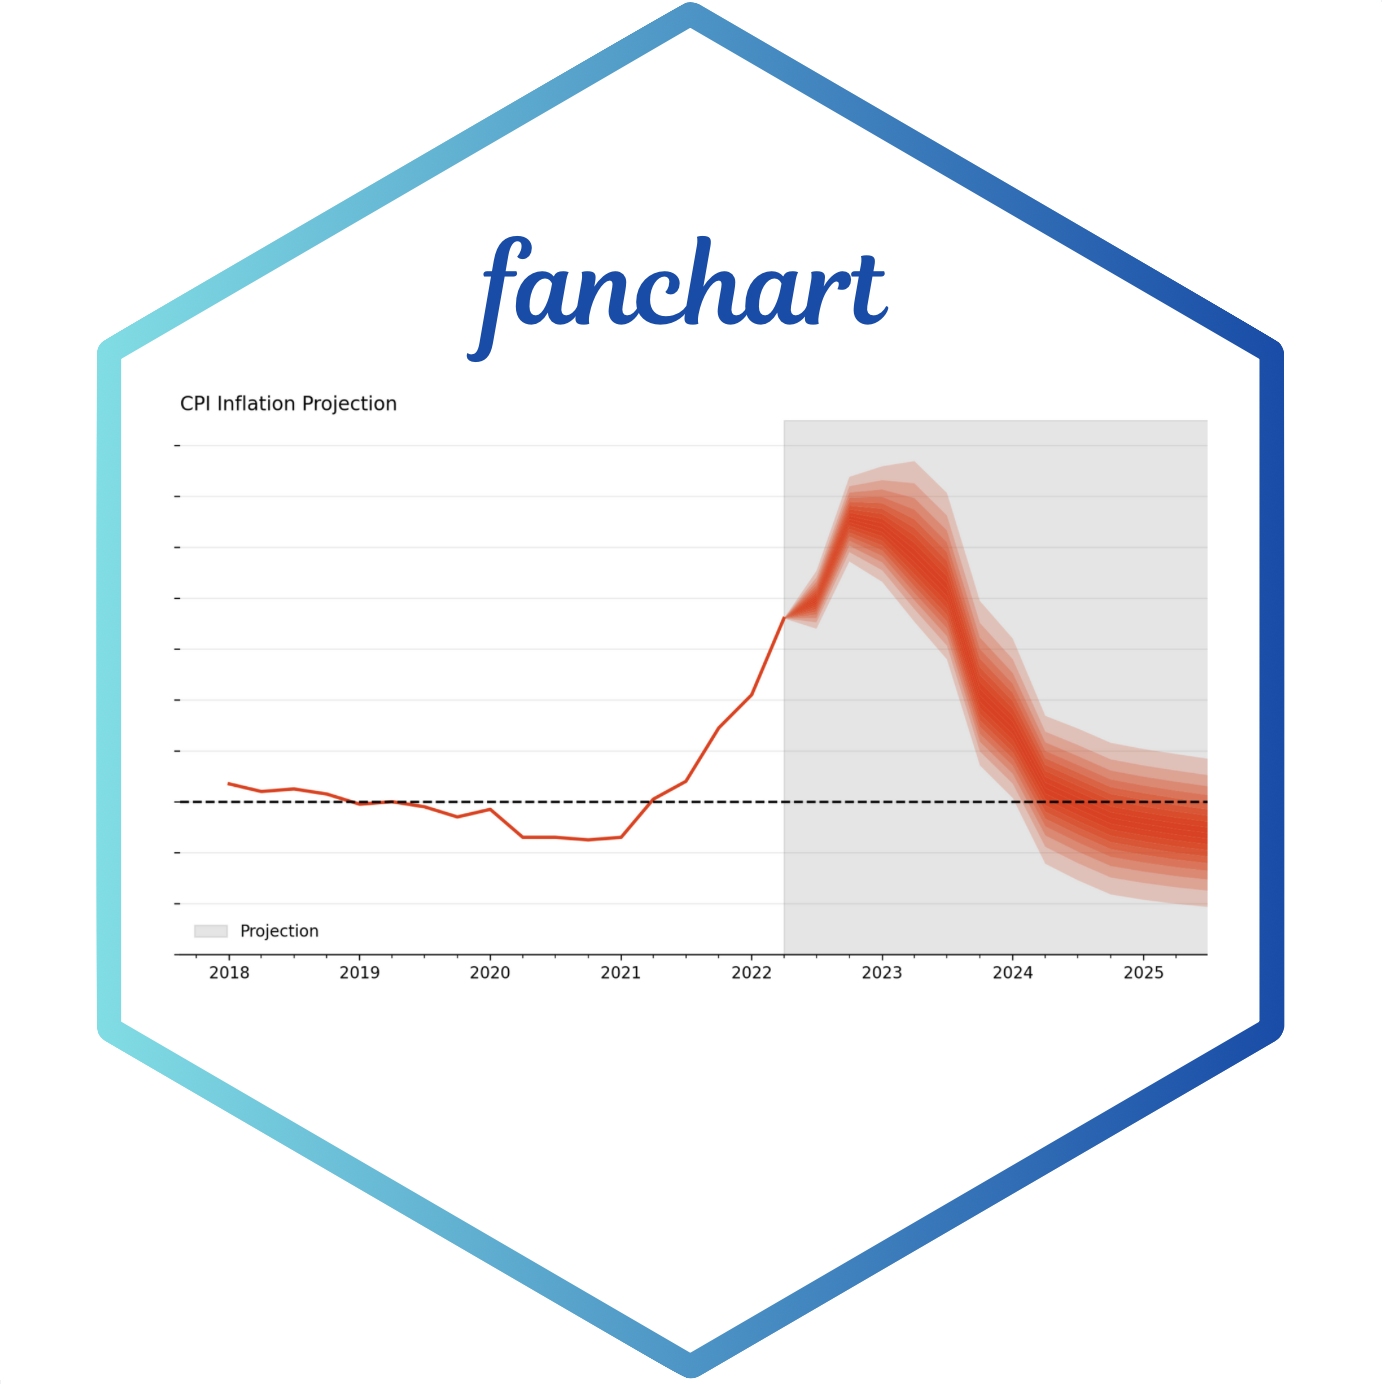
📦 Python library to create Fan Charts as introduced by the Bank of England in 1996
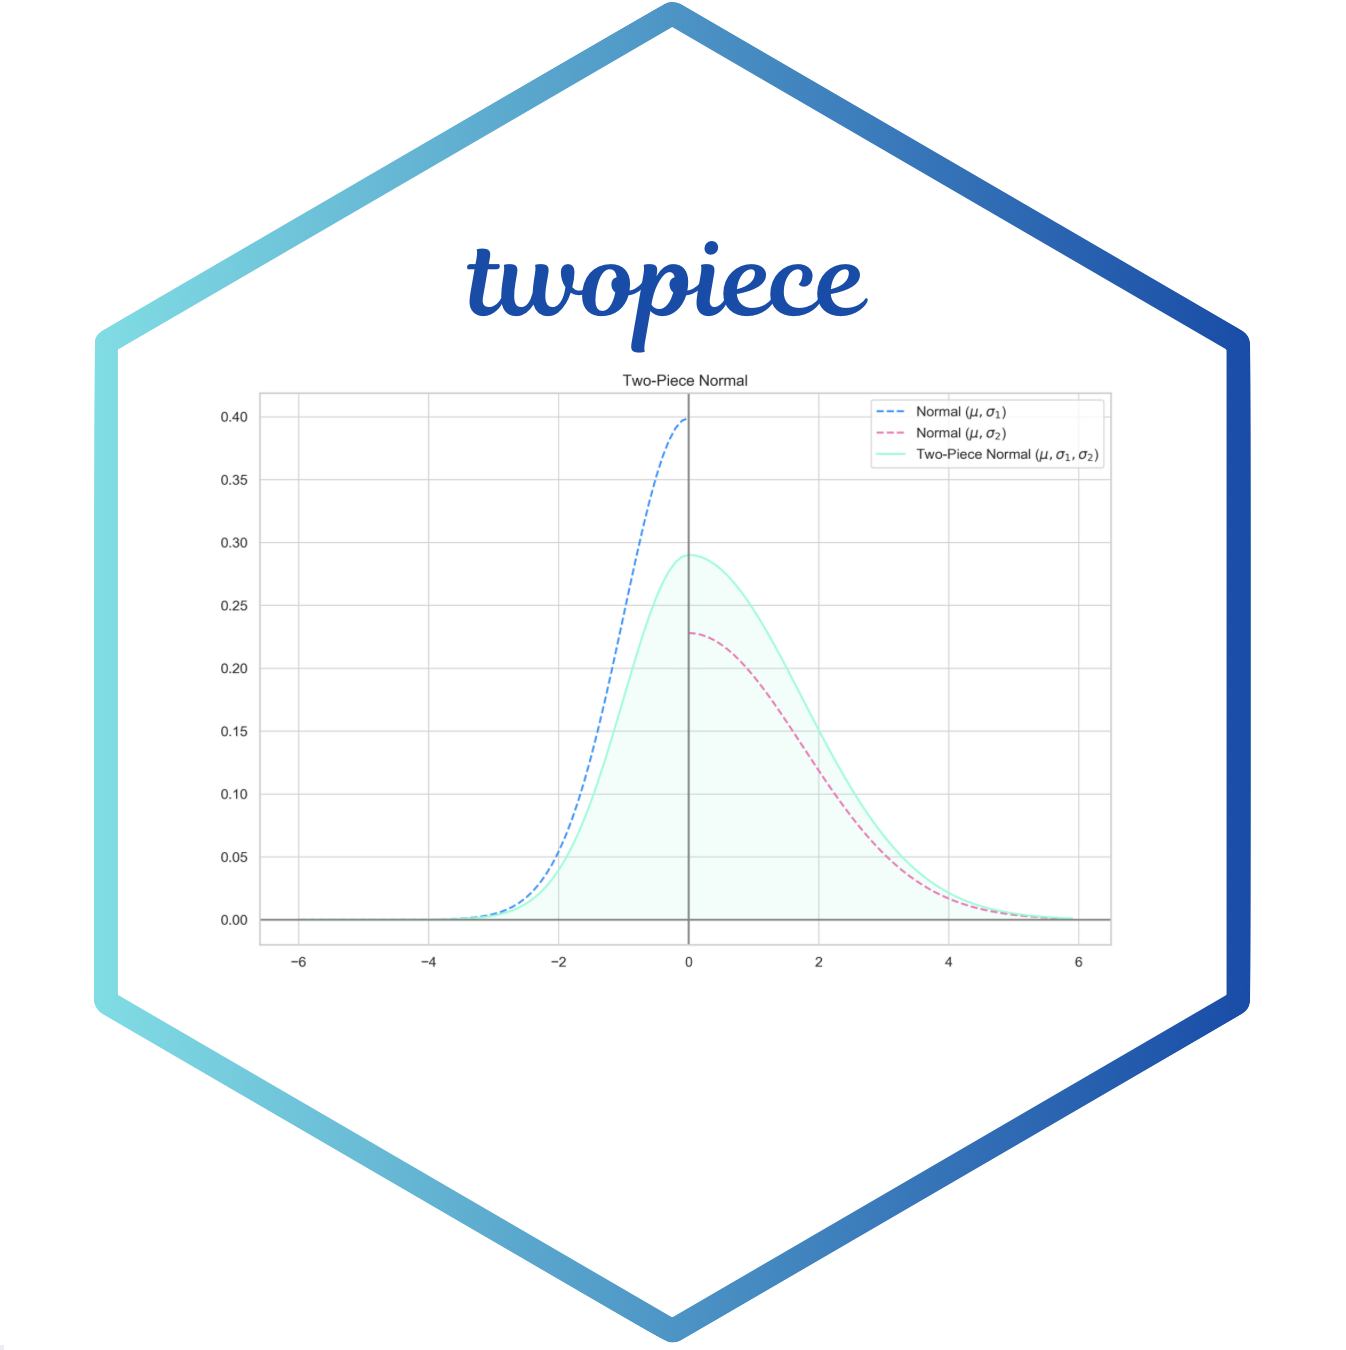
📦 Python library providing Two-Piece distributions functionality. It covers the subfamilies: TP Scale, TP Shape, and Double TP.